NIFTY set to decline to 9075 in FY 18-19
07 APR 2018
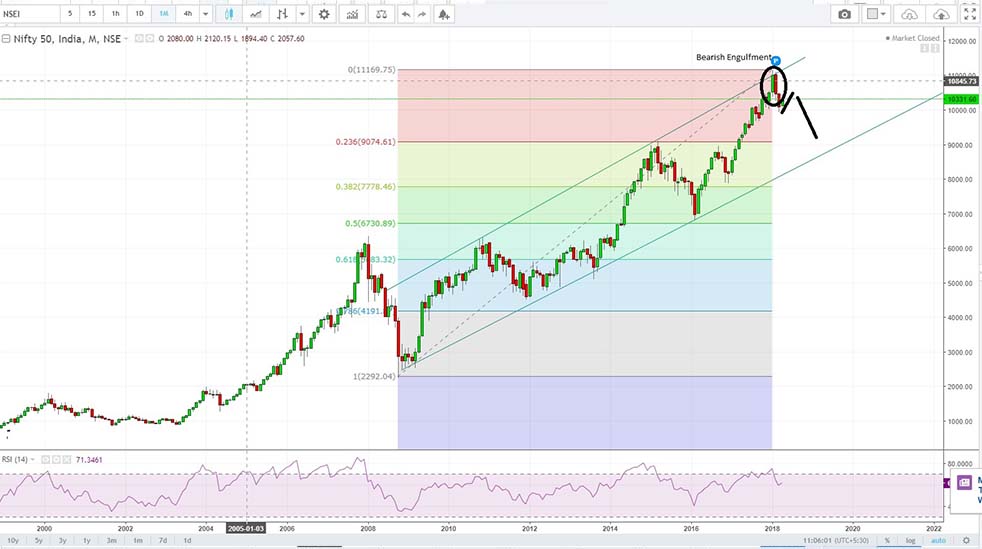
Correction from January 2018 in Nifty should not have been a surprise to anybody if anyone was following the long term channel set from 2009 when NIFTY was at 2300 and it rallied to 11171 in January 2018.Below is the monthly chart of NIFTY which set to rise in 2009 and has been trading within the set rising channel and after hitting the upper channel resistance at 11000 levels it is very much expected to correct maximum to 9075 ( 23.6% Fibonacci retracement of the rally from 2292 to 11169) levels by March 2019 after which it’s expected to resume the long term trend again. While we had forecasted the maximum of 9075 but not necessary market will correct to that level but that’s the maximum level the market could correct to keep the long term bull run intact.
As seen on the monthly chart below , monthly close of February marked the “ Bearish Engulfment “ and hence further validate our stand for a good correction in the equity this year citing domestic and global cues which are global equity sell off ,tightening global liquidity , risk aversion on Trump policy decision and IN election year, rising crude prices, widening fiscal and current account deficit something which we have mentioned in our Rupee forecast HI report shared recently. So from here on for a week or so we expect NIFTY to test the upper resistance zone of 10500-10600 levels before selling pressure to resume again and break of 10000 will be needed to resume the downward trend towards first target of 9695, break of which will target 9075 ahead of the long bull run again.9075 is the second peak of the larger trend which is the major long term support which also coincides with 23.6% Fibonacci retracement of the rally from 2292 and 11169 and hence that support should hold else the bull run is over.